

So, you’ve determined your ideal customer profile (ICP), selected your target account list, and prepared your sales and marketing assets for your brand-new ABM campaign. You’re ready to take that first step toward better targeting and higher marketing ROI, but there’s a problem: how should you measure the success of your ABM campaign? And more importantly, how do you focus on the key metrics that matter to your executive team when you talk about the success of your campaign?
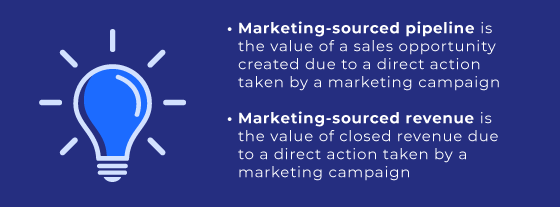
We find that the two metrics that matter most to prove marketing ROI are marketing-sourced revenue and marketing-sourced pipeline value, with 47% of dashboards highlighting either marketing-sourced pipeline or revenue.
Believe it or not, more ABM marketers struggle with these two metrics than you think. According to SirirusDecisions Command Center, 21% of ABM practitioners say they don’t or can’t measure the ROI of their account-based marketing strategy. Why? Because B2B buying cycles are complex. A 2020 Forrester report finds that B2B buying cycles typically involve an average of 27 interactions between buyers and sellers where 95% of B2B purchases are made by a group of 3 or more individuals.
Marketing teams that cannot show and report on ABM performance will struggle with support and resources to fund their ABM efforts. If you cannot show that your ABM campaign is working to fuel your sales pipeline and increase revenue for your organization, you will struggle to justify budget increases and more resources for ABM.
You can show the value of your ABM campaigns through the lens of the 3 Vs:
- Volume
- Value
- Velocity
Volume
Don’t worry—we’re not returning to high school geometry class for this one. Volume is simply the number of leads AND opportunities in your pipeline. Why both? While leads provide a pool of prospective customers, it is not the best way to measure marketing’s impact on a pipeline.
Leading organizations are taking a different approach by focusing on leads AND the volume of opportunities. Opportunities give more context by associating a deal amount if that opportunity were to close. You can gauge how effective your marketing campaigns are by comparing opportunities against leads. Do you have more leads than opportunities? If so, you may need to examine what other assets you can serve to leads that will turn them into opportunities.
So, here are the key metrics you can use to determine volume:
- Leads: Record how many decision-makers within the target account you reached with your marketing. These are your leads. A higher number of individuals = higher the likelihood of sales opportunities!
- Opportunities: Examine your pipeline for the number of opportunities with associated deal values you’ve created.
Value
Value is how much you’re getting back from the accounts you’re targeting with your ABM campaigns. Confirming a deal’s value is a great way to understand how your ABM campaign can help increase deal value size with additional assets, nurturing paths, and syndication schedules. Value can be based on customer experiences: greater awareness of a problem they are trying to solve, and trust in your brand to educate them in a better way. Accomplishing these experiences with your campaign strategy will increase deal values.
For example, a general contractor engages with your content because they know they need cloud-based bid management software. After reading a white paper that educates them about the benefits of an end-to-end general contractor software that includes a bid management solution, they request a demo for your end-to-end platform solution. They recognized a more significant problem and adjusted their purchase criteria to account for investing more in your solution. This example also demonstrates trust in your brand by acknowledging that they need more from you based on your delivered whitepaper.
You can measure value in averages:
- Average opportunity size: This is a great metric to evaluate the value of your deals in the pipeline. Use all the approximate target account deals in progress in your pipeline, add them up (this is your pipeline value), and divide by the number of deals. This should be the leading indicator for your average deal size.
- Average deal size: Look at the final numbers for closed deals and then divide that by the number of closed deals. You’ll have the average deal size. Average deal size can be one of the best metrics to watch because when you can increase the average value of a deal, the lifetime customer value tells a valuable and defensible story for your ABM campaign.
Velocity
This metric is all about speed, recognizing the average time an account converts from a lead to an opportunity to a customer. B2B sales cycles are complex and some can stretch weeks, months, even years. So, it’s important that your ABM campaign targets the individual at every sales cycle stage.
For most ABM marketers, there are six stages to the buying cycle:
- Awareness: When the account realizes they have a problem they need to solve with a solution/service.
- Commitment to change: The account commits to thinking about how to fix the problem. They look at their budget, what issues will be addressed by the solution, and how the solution will fit into their technology stack.
- Consideration: The account researches solutions for their problem and evaluates vendors like you.
- Commitment to a solution: This is where the account shortlists the vendors that have the solution they need.
- Decision: This is where the entire buying committee deliberates on the chosen solutions and engages with a sales rep that needs to prove your solution’s merit.
- Final Selection: The account will decide on which vendor they need to use.
By understanding how accounts move from Awareness to Final Selection, you can customize your account nurturing, segmentation, and content strategy to accelerate these key accounts faster. Velocity is the speed at which your target accounts move through the sales cycle.
- Stage duration: If your ABM platform cannot show this, calculate the number of days leads/opportunities last in one stage of the buying cycle and how long it took them to move to the next stage.
- Pipeline velocity: If your ABM measurement platform cannot tell you this, we’ve got a formula you can use for now: (your number of opportunities) X (your average deal size) X (conversion rate) / (sales cycle length) = pipeline velocity
Wrapping It Up
If you are not tracking the key metrics that help you determine marketing-influenced pipeline and revenue, you cannot report on the actual value of your ABM campaign. By using the 3 Vs—Volume, Value & Velocity—you can evaluate your ABM campaign to increase net-new client acquisition, customer expansion, and your impact on the sales pipeline. Additionally, you can report on your marketing-sourced pipeline and revenue by measuring these 3 V metrics we’ve shared with you.
Madison Logic understands the complex nature of measuring ABM campaigns. We provide you with a single source of truth into the performance of your ABM campaigns through the ML Platform. The ML Platform is the most efficient way to show how cross-channel campaigns impact your sales pipeline and revenue. Demonstrate account engagement and pipeline impact across the three dominant media channels marketers use today!
- Need more guidance in your go-to-market ABM campaign? Download our 2026 ABM Playbook
- What can you do to improve your ABM campaign performance? Read our COO and Co-Founder’s take on Why Marketers Need a Comprehensive View of Account Engagement and Pipeline 2022
- Looking for a real-life example of measuring important ABM metrics? Read about how PGI realized 350% ROI on Madison Logic ABM Program Spend

